

The MemOptimized RowStore introduced in Oracle Database 18c is designed to improve the performance of simple queries accessing data via primary key columns only. An example of such a query is SELECT value FROM t WHERE key = :key where key is the only primary key column of table t. This feature is available for the following Oracle Database offerings only (see Licensing Information User Manual):
- Oracle Database Enterprise Edition on Engineered Systems (EE-ES)
- Oracle Database Cloud Service Enterprise Edition – Extreme Performance (DBCS EE-EP)
- Oracle Database Exadata Cloud Service (ExaCS)
For this blog post I’ve used a Docker container running an Oracle Database 18c version 18.2.0.0.180417 on my MacBook Pro (Late 2016). The initialization parameter _exadata_feature_on=TRUE enabled technically the MemOptimized RowStore. This means that I expect the feature to work but with different performance metrics as on one of the officially supported environments.
Concept
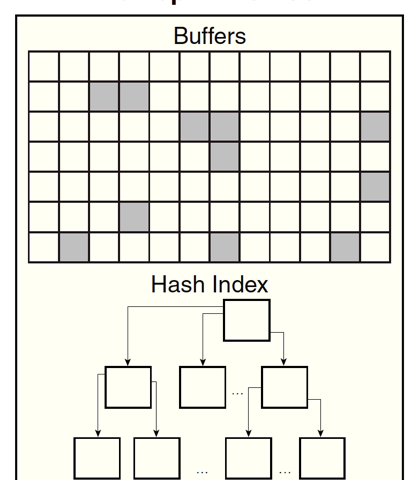
The MemOptimized RowStore is conceptually best documented in Database Concepts. The idea is to store a heap-organized table completely in the memory within a subarea of the SGA. This subarea is named Memoptimized Pool and consists of the following two parts:
- Memoptimize Buffer Area
This is a dedicated buffer cache for table blocks. 75% of the memoptimized pool is reserved for this buffer cache.
- Hash Index
A hash index is a hash table/map as we know it from Java and other programming languages (associative array in PL/SQL). The primary key columns are used as key and a pointer to the block in the memoptimize buffer area is used as value. The hash index uses the other 25% of the memoptimized pool.
The size of the memoptimized pool is set by the initialization parameter MEMOPTIMIZE_POOL_SIZE. The default size is 0. Changing the value requires to restart of the database. The minimum size is 100M.
The following conditions must be met to use the MemOptimized RowStore:
- The table is marked as
MEMOPTIMIZE FOR READ. See the memoptimize_read_clause forCREATE TABLEandALTER TABLEstatements. - The table is heap-organized.
- The table has a primary key.
- The primary key is not an identity column.
- The table is not compressed.
- The table is not reference-partitioned.
- The table has at least one segment (use
SEGMENT CREATION IMMEDIATEwhen creating tables). - The table has been loaded in the memoptimized pool using dbms_memoptimize.populate.
- The table fits completely in the memoptimized pool.
- The query must be in the format
SELECT <column_list> FROM <table> WHERE <primary_key_column> = <value>. The result columns must derive from the underlying table. Multiple primary key columns are supported, in this case, all primary key columns have to be defined in thewhere_clause. Additional predicates are not allowed. - The initialization parameter
STATISTICS_LEVELmust not be set toALL. - The optimizer hint
GATHER_PLAN_STATISTICSmust not be used. - SQL trace must not be enabled.
- The query must not be executed within PL/SQL (neither static nor dynamic SQL is supported).
- The query must not be executed using the default database connection in a Java-stored procedure.
- The query must not be executed from a JDBC thin driver connection. You have to use OCI, otherwise the performance will be really bad, see the succeeding blog post MemOptimized RowStore in Oracle Database 18c with OCI. This might be a bug. [added on 2018-06-19].
If all conditions are met, then the row is fetched without a single logical I/O. In all other cases, you get either an error message or the query is executed the conventional way, using at least 3 logical I/Os (1 I/O for the root index block, 1 I/O for the index leaf block, 1 I/O for the table block).
Existing applications do not need to change their code to use the MemOptimized RowStore (besides some DDL).
But how can a row be fetched without an I/O? Technically it is a new kind of I/O which is no longer accounted for the wait event consistent gets. Instead, these operations are reported with new wait events:
memopt r lookups– counting every hash index lookup (regardless of the result)memopt r hits– counting every successful hash index lookup (primary key found)memopt r misses– counting every unsuccessful hash index lookup (primary key not found)
There are 65 wait events in v$statname for the MemOptimized RowStore. You find some descriptions in the Database Reference as well.
But why is this supposed to be faster than a single block access in the keep pool using a single-table hash cluster? The answer is given in the Introducing Oracle Database 18c whitepaper:
Key-value lookups then bypass the SQL execution layer and execute directly in the data access layer via an in-memory hash index.
And what are the expected performance gains? – I have not found any numbers in the documentation. Unfortunately, my tests are not conclusive in this area, since I’m running them in an unsupported environment. However, I’ve found an answer on the Ask TOM website, where Maria Colgan states the following:
the rowstore can be approximately 25% faster than a single-table hash cluster
Configure Database
Before we can use the MemOptimized RowStore we have to set the size of the memoptimized pool. In this case, I set the minimum size and restart the database.
ALTER SYSTEM SET memoptimize_pool_size = 100M SCOPE=SPFILE;
SHUTDOWN IMMEDIATE
STARTUP
Now the database has reserved 75 megabytes for the memoptimize buffer area and 25 megabytes for the hash index.
Create and Populate Table
Let’s create an empty table t4 with an memoptimize_read_clause.
CREATE TABLE t4 (
   key    INTEGER            NOT NULL,
   value  VARCHAR2(30 CHAR)  NOT NULL,
   CONSTRAINT t4_pk PRIMARY KEY (key)
)
SEGMENT CREATION IMMEDIATE
MEMOPTIMIZE FOR READ;
Please note, that the primary key definition on line 4 is required to avoid an ORA-62142: MEMOPTIMIZE FOR READ feature requires NOT DEFERRABLE PRIMARY KEY constraint on the table. And without the clause on line 6, we’d get an ORA-62156: MEMOPTIMIZE FOR READ feature not allowed on segment with deferred storage.
I use the following anonymous PL/SQL block to populate the table t4 with 100,000 rows and gather table statistics.
BEGIN
   dbms_random.seed(0);
   INSERT INTO t4 (key, value)
   SELECT rownum AS key,
          dbms_random.string('x', round(dbms_random.value(5, 30), 0)) AS value
     FROM xmltable('1 to 100000');
   COMMIT;
   dbms_stats.gather_table_stats(ownname=>USER, tabname=>'T4');
END;
/
We may now run a query in an SQL client. I’ve used SQLcl because of the comprehensive statistics when using autotrace. The output is the result of the second execution.
SET LINESIZE 100
SET AUTOTRACE ON
SELECT * FROM t4 WHERE key = 42;

       KEY VALUE
---------- ------------------------------
        42 UKPBW05FQ1

Explain Plan
-----------------------------------------------------------

PLAN_TABLE_OUTPUT
----------------------------------------------------------------------------------------------------
Plan hash value: 1143490106

------------------------------------------------------------------------------------------------
| Id  | Operation                              | Name  | Rows  | Bytes | Cost (%CPU)| Time     |
------------------------------------------------------------------------------------------------
|   0 | SELECT STATEMENT                       |       |     1 |    24 |     2   (0)| 00:00:01 |
|   1 |  TABLE ACCESS BY INDEX ROWID READ OPTIM| T4    |     1 |    24 |     2   (0)| 00:00:01 |
|*  2 |   INDEX UNIQUE SCAN READ OPTIM         | T4_PK |     1 |       |     1   (0)| 00:00:01 |
------------------------------------------------------------------------------------------------

Predicate Information (identified by operation id):
---------------------------------------------------

   2 - access("KEY"=42)

Statistics
-----------------------------------------------------------
               1  CPU used by this session
               1  CPU used when call started
               2  DB time
              42  Requests to/from client
              42  SQL*Net roundtrips to/from client
               3  buffer is not pinned count
             598  bytes received via SQL*Net from client
           83338  bytes sent via SQL*Net to client
               3  calls to get snapshot scn: kcmgss
               2  calls to kcmgcs
               3  consistent gets
               3  consistent gets examination
               3  consistent gets examination (fastpath)
               3  consistent gets from cache
               2  execute count
               1  index fetch by key
           24576  logical read bytes from cache
               1  memopt r lookups
               1  memopt r misses
              43  non-idle wait count
               2  opened cursors cumulative
               1  opened cursors current
               2  parse count (total)
               1  rows fetched via callback
               1  session cursor cache hits
               3  session logical reads
               1  sorts (memory)
            2011  sorts (rows)
               1  table fetch by rowid
              45  user calls
The execution plan on lines 20 and 21 shows the intention to use the MemOptimized RowStore (READ OPTIM). But the 3 consistent gets on line 41 indicates that a conventional index access has been used. We get the proof on lines 48 and 49. There was an access to the hash index (1 memopt r lookups), but no key with the value 42 has been found (1 memopt r misses). Hence the fallback to the conventional unique index access.
Populate MemOptimized RowStore
The following anonymous PL/SQL block populates the memoptimized pool for the table t4.
BEGIN
   dbms_memoptimize.populate(schema_name=>USER, table_name=>'T4');
END;
/
It is important to note, that the memoptimized pool is populated in the background by a space management worker process. This call is just a request, with a own wait event memopt r populate tasks accepted. Usually this is pretty fast, but to be sure you can check the relevant wait event before and after calling dbms_memoptimize.populate. Here’s an example:
SELECT n.name, s.value
  FROM v$sysstat s
  JOIN v$statname n
    ON n.statistic# = s.statistic#
 WHERE n.name = 'memopt r rows populated';

NAME                                                                  VALUE
---------------------------------------------------------------- ----------
memopt r rows populated                                              100000
100,000 rows are now in the memoptimized pool. Let’s query the table t4 again.
SET LINESIZE 100
SET AUTOTRACE ON
SELECT * FROM t4 WHERE key = 42;

       KEY VALUE
---------- ------------------------------
        42 UKPBW05FQ1

Explain Plan
-----------------------------------------------------------

PLAN_TABLE_OUTPUT
----------------------------------------------------------------------------------------------------
Plan hash value: 1143490106

------------------------------------------------------------------------------------------------
| Id  | Operation                              | Name  | Rows  | Bytes | Cost (%CPU)| Time     |
------------------------------------------------------------------------------------------------
|   0 | SELECT STATEMENT                       |       |     1 |    24 |     2   (0)| 00:00:01 |
|   1 |  TABLE ACCESS BY INDEX ROWID READ OPTIM| T4    |     1 |    24 |     2   (0)| 00:00:01 |
|*  2 |   INDEX UNIQUE SCAN READ OPTIM         | T4_PK |     1 |       |     1   (0)| 00:00:01 |
------------------------------------------------------------------------------------------------

Predicate Information (identified by operation id):
---------------------------------------------------

   2 - access("KEY"=42)

Statistics
-----------------------------------------------------------
              43  Requests to/from client
              43  SQL*Net roundtrips to/from client
             605  bytes received via SQL*Net from client
           83447  bytes sent via SQL*Net to client
               3  calls to get snapshot scn: kcmgss
               2  calls to kcmgcs
               2  execute count
               1  memopt r hits
               1  memopt r lookups
              44  non-idle wait count
               2  opened cursors cumulative
               1  opened cursors current
               2  parse count (total)
               1  session cursor cache count
               1  sorts (memory)
            2011  sorts (rows)
              46  user calls
As before, the execution plan on lines 20 and 21 shows the intention to use the MemOptimized RowStore (READ OPTIM). But in this case, there are no consistent gets. And on line 38 we have a successful hash index lookup (1 memopt r hits). A SQL query without logical I/Os, made possible by the MemOptimized RowStore.
Alternatives
What are your options, when your database does not provide a MemOptimized RowStore? I see the primarily the following alternatives:
- Heap-organized table
- Index-organized table
- Single-table hash cluster
Let’s elaborate on them.
1. Heap-Organized Table
CREATE TABLE t1 (
   key    INTEGER            NOT NULL,
   value  VARCHAR2(30 CHAR)  NOT NULL,
   CONSTRAINT t1_pk PRIMARY KEY (key)
)
STORAGE (BUFFER_POOL KEEP);
ALTER INDEX t1_pk STORAGE (BUFFER_POOL KEEP);
This is very similar to table t4. The storage_clauses on lines 6 and 7 ensure that the table and index blocks are stored in the KEEP buffer pool. This will reduce the physical I/Os when querying the table.
Accessing a single row requires 3 consistent gets as shown below.
SET LINESIZE 100
SET AUTOTRACE ON
SELECT * FROM t1 WHERE key = 42;

       KEY VALUE
---------- ------------------------------
        42 UKPBW05FQ1

Explain Plan
-----------------------------------------------------------

PLAN_TABLE_OUTPUT
----------------------------------------------------------------------------------------------------
Plan hash value: 2347959165

-------------------------------------------------------------------------------------
| Id  | Operation                   | Name  | Rows  | Bytes | Cost (%CPU)| Time     |
-------------------------------------------------------------------------------------
|   0 | SELECT STATEMENT            |       |     1 |    24 |     2   (0)| 00:00:01 |
|   1 |  TABLE ACCESS BY INDEX ROWID| T1    |     1 |    24 |     2   (0)| 00:00:01 |
|*  2 |   INDEX UNIQUE SCAN         | T1_PK |     1 |       |     1   (0)| 00:00:01 |
-------------------------------------------------------------------------------------

Predicate Information (identified by operation id):
---------------------------------------------------

   2 - access("KEY"=42)

Statistics
-----------------------------------------------------------
              42  Requests to/from client
              42  SQL*Net roundtrips to/from client
               3  buffer is not pinned count
             598  bytes received via SQL*Net from client
           83426  bytes sent via SQL*Net to client
               2  calls to get snapshot scn: kcmgss
               2  calls to kcmgcs
               3  consistent gets
               3  consistent gets examination
               3  consistent gets examination (fastpath)
               3  consistent gets from cache
               1  cursor authentications
               2  execute count
               1  index fetch by key
           24576  logical read bytes from cache
              42  non-idle wait count
               2  opened cursors cumulative
               1  opened cursors current
               2  parse count (total)
               1  rows fetched via callback
               3  session logical reads
               1  sorts (memory)
            2011  sorts (rows)
               1  table fetch by rowid
              45  user calls
2. Index-Organized Table
CREATE TABLE t2 (
   key    INTEGER            NOT NULL,
   value  VARCHAR2(30 CHAR)  NOT NULL,
   CONSTRAINT t2_pk PRIMARY KEY (key)
)
ORGANIZATION INDEX
STORAGE (BUFFER_POOL KEEP);
An index-organized table stores all its data within the index structure. This reduces the logical I/Os by one when accessing a single row via the primary key. We also use the KEEP buffer pool to minimize physical I/Os.
Accessing a single row requires 2 consistent gets as shown below.
SET LINESIZE 100
SET AUTOTRACE ON
SELECT * FROM t2 WHERE key = 42;

       KEY VALUE
---------- ------------------------------
        42 UKPBW05FQ1

Explain Plan
-----------------------------------------------------------

PLAN_TABLE_OUTPUT
----------------------------------------------------------------------------------------------------
Plan hash value: 2827726509

---------------------------------------------------------------------------
| Id  | Operation         | Name  | Rows  | Bytes | Cost (%CPU)| Time     |
---------------------------------------------------------------------------
|   0 | SELECT STATEMENT  |       |     1 |    24 |     1   (0)| 00:00:01 |
|*  1 |  INDEX UNIQUE SCAN| T2_PK |     1 |    24 |     1   (0)| 00:00:01 |
---------------------------------------------------------------------------

Predicate Information (identified by operation id):
---------------------------------------------------

   1 - access("KEY"=42)

Statistics
-----------------------------------------------------------
              42  Requests to/from client
              42  SQL*Net roundtrips to/from client
               1  buffer is not pinned count
             598  bytes received via SQL*Net from client
           83426  bytes sent via SQL*Net to client
               2  calls to get snapshot scn: kcmgss
               2  calls to kcmgcs
               2  consistent gets
               2  consistent gets examination
               2  consistent gets examination (fastpath)
               2  consistent gets from cache
               1  cursor authentications
               2  execute count
               1  index fetch by key
           16384  logical read bytes from cache
              42  non-idle wait count
               2  opened cursors cumulative
               1  opened cursors current
               2  parse count (total)
               2  session logical reads
               1  sorts (memory)
            2011  sorts (rows)
              45  user calls
3. Single-Table Hash Cluster
CREATE CLUSTER c3 (key INTEGER)
   SIZE 256
   SINGLE TABLE HASHKEYS 100000
   STORAGE (BUFFER_POOL KEEP);

CREATE TABLE t3 (
   key    INTEGER            NOT NULL,
   value  VARCHAR2(30 CHAR)  NOT NULL,
   CONSTRAINT t3_pk PRIMARY KEY (key) -- to check uniqueness only
)
CLUSTER c3 (key);
A hash cluster is quite an old Oracle feature. I do not remember when it was introduced. It’s like it has always been around. The best option for primary key-based data retrieval, but a bit tricky to size. For sizing a hash cluster two parameters are important:
- HASHKEYS
The HASHKEYS parameter (see line 3) defines the number of target buckets for the hash function. In this case, I chose 100,000. Without hash collisions, every key would be stored in its own bucket. But with this dataset, there are up to 5 keys which get stored in the same target bucket.
- SIZE
The SIZE parameter (see line 2) defines the number of bytes initially reserved for a target bucket of a hash function. Since I know that there are up to 5 rows within a bucket and I want a bucket to be stored completely in a single block, I chose a size large enough for 5 rows. This leads to 256 bytes so that I can store 32 buckets in a single 8K block.
With these parameters, a cluster with 3,125 blocks will be created. It is probably a bit more. How much depends on the extent management configuration of the tablespace. This is optimal for our use case. But it is not optimal for full table scans, since we use 6-7 times more blocks than needed for a heap-organized table.
Accessing a single row in a correctly sized single-table hash cluster requires just 1 consistent get as shown below.
SET LINESIZE 100
SET AUTOTRACE ON
SELECT * FROM t3 WHERE key = 42;

       KEY VALUE
---------- ------------------------------
        42 UKPBW05FQ1

Explain Plan
-----------------------------------------------------------

PLAN_TABLE_OUTPUT
----------------------------------------------------------------------------------------------------
Plan hash value: 180373899

--------------------------------------------------------------------------
| Id  | Operation         | Name | Rows  | Bytes | Cost (%CPU)| Time     |
--------------------------------------------------------------------------
|   0 | SELECT STATEMENT  |      |     1 |    24 |     1   (0)| 00:00:01 |
|*  1 |  TABLE ACCESS HASH| T3   |     1 |    24 |     1   (0)| 00:00:01 |
--------------------------------------------------------------------------

Predicate Information (identified by operation id):
---------------------------------------------------

   1 - access("KEY"=42)

Statistics
-----------------------------------------------------------
               1  DB time
              42  Requests to/from client
              42  SQL*Net roundtrips to/from client
               1  buffer is not pinned count
             598  bytes received via SQL*Net from client
           83491  bytes sent via SQL*Net to client
               2  calls to get snapshot scn: kcmgss
               2  calls to kcmgcs
               1  cluster key scan block gets
               1  cluster key scans
               1  consistent gets
               1  consistent gets from cache
               1  consistent gets pin
               1  consistent gets pin (fastpath)
               2  execute count
            8192  logical read bytes from cache
              42  non-idle wait count
               2  opened cursors cumulative
               1  opened cursors current
               2  parse count (total)
               1  session cursor cache hits
               1  session logical reads
               1  sorts (memory)
            2011  sorts (rows)
              45  user calls
If you size the single-table hash cluster incorrectly, for example, by using SIZE 64 HASHKEYS 500 you end up with more than 150 consistent gets to access a single row resulting in bad performance.
Sizing a single-table hash cluster is really the key for best performance. However, for mixed workloads (PK access and other accesses to retrieve many rows) sizing becomes challenging and leads to a compromise. In such scenarios a heap-organized or index-organized table is easier to apply and may even be the better option.
Performance
Now let’s compare these four options using a PL/SQL and a Java program reading the table fully via 100,000 queries. Not a smart way to do it, but it should show the performance impact of the different data structures.
CREATE OR REPLACE PROCEDURE p (in_table_name VARCHAR2) IS
   l_query VARCHAR2(1000 CHAR);
   l_value VARCHAR2(30 CHAR);
   l_start INTEGER;
   l_end   INTEGER;
BEGIN
   l_start := dbms_utility.get_time();
   l_query := 'SELECT value FROM ' || in_table_name || ' WHERE key = :key';
   FOR i IN 1..100000 LOOP
      EXECUTE IMMEDIATE l_query INTO l_value USING i;
   END LOOP;
   l_end := dbms_utility.get_time();
   dbms_output.put_line('read 100000 rows from ' || in_table_name || ' in ' ||
      to_char((l_end - l_start) / 100) || ' seconds.');
END p;
/import java.sql.Connection;
import java.sql.DriverManager;
import java.sql.PreparedStatement;
import java.sql.ResultSet;
import java.sql.SQLException;
import oracle.jdbc.driver.OracleDriver;
public class J {
private static boolean isRunningInDatabase() {
return System.getProperty("oracle.jserver.version") != null;
}
public static void m(String tableName) throws SQLException {
Connection conn;
if (isRunningInDatabase()) {
conn = new OracleDriver().defaultConnection();
} else {
conn = DriverManager.getConnection(
"jdbc:oracle:thin:@//localhost:1521/odb.docker", "tvdca", "tvdca");
}
conn.setAutoCommit(false);
long start = System.currentTimeMillis();
String query = "SELECT value FROM " + tableName + " WHERE key = ?";
PreparedStatement ps = conn.prepareStatement(query);
for (long i = 1; i <= 100000; i++) {
ps.setLong(1, i);
ResultSet rs = ps.executeQuery();
while (rs.next()) {
rs.getString("value");
}
rs.close();
}
ps.close();
if (!isRunningInDatabase()) {
conn.close();
}
long end = System.currentTimeMillis();
System.out.println("read 100000 rows from " + tableName + " in " +
String.valueOf((double) (end-start)/1000) + " seconds.");
}
public static void main(String[] args) throws SQLException {
m(args[0]);
}
}Both programs are doing the same work. They get a table name as a parameter and retrieve every row in the table via primary key access. The PL/SQL procedure runs within the database and the Java program outside of the database. The Java program needs to do 100,000 network round trips. For the PL/SQL program, these are just context switches between the PL/SQL and SQL engine. Therefore, the PL/SQL procedure calls are expected to be faster than the Java program executions.
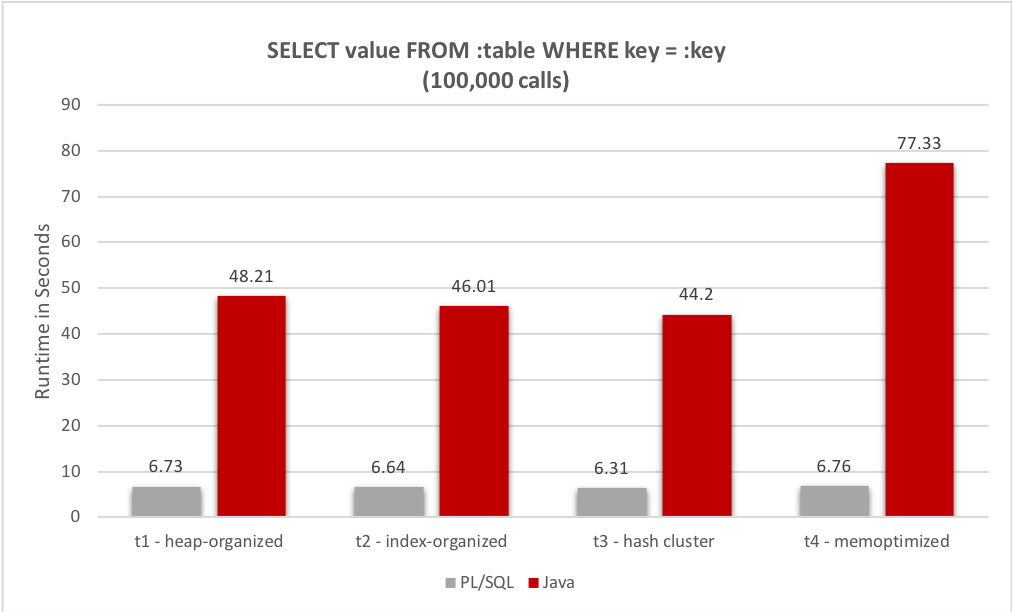
Each program has been called five times for every table. The slowest and the fastest runtimes have been ignored. The average of the remaining three runtimes is used for the following chart.
The results look plausible for “t1 – heap-organized”, “t2 – index-organized” and “t3 – hash cluster”. But the runtimes for “t4 – memoptimized” are strange. For PL/SQL and Java. This requires further analysis.
Analyzing PL/SQL Runtime for “t4 – memoptimized”
Let’s execute the PL/SQL procedure in a fresh session again.
SQL> connect tvdca/tvdca@odb
Connected.
SQL> set serveroutput on
SQL> exec p('t4')
read 100000 rows from t4 in 6.72 seconds.


PL/SQL procedure successfully completed.

SQL> SELECT n.name, s.sid, s.value
  2    FROM v$sesstat s
  3    JOIN v$statname n
  4      ON n.statistic# = s.statistic#
  5   WHERE n.name in ('consistent gets','memopt r lookups', 'memopt r hits')
  6     AND s.value > 0
  7     AND s.sid = sys_context ('USERENV', 'SID')
  8   ORDER BY s.value desc;

NAME                                                                    SID      VALUE
---------------------------------------------------------------- ---------- ----------
consistent gets                                                         273     300025
Line 21 is interesting. 300,025 consistent gets. These are 300,000 more than expected. And there are no values for the wait events memopt r lookups and memopt r hits. This means Oracle uses a conventional access path instead of the MemOptimized RowStore. It’s the same execution plan as for “t1 – heap-organized” and the execution times are similar as well. As mentioned in the Concept chapter in the beginning, the MemOptimized RowStore cannot be used from PL/SQL.
Analyzing Java Runtime for “t4 – memoptimized”
To analyze the problem I’ve enabled SQL trace for the Java session. I was surprised by the runtime. Significantly faster with SQL trace enabled? The tkprof output revealed the reason. Here is an excerpt:
SQL ID: 03z4487kpgfv3 Plan Hash: 1143490106

SELECT value
FROM
 t4 WHERE key = :1


call     count       cpu    elapsed       disk      query    current        rows
------- ------  -------- ---------- ---------- ---------- ----------  ----------
Parse        1      0.00       0.00          0          0          0           0
Execute 100000      0.65       7.10          0          0          0           0
Fetch   100000      0.95       7.36          0     300000          0      100000
------- ------  -------- ---------- ---------- ---------- ----------  ----------
total   200001      1.60      14.47          0     300000          0      100000

Misses in library cache during parse: 1
Misses in library cache during execute: 1
Optimizer mode: ALL_ROWS
Parsing user id: 152
Number of plan statistics captured: 1

Rows (1st) Rows (avg) Rows (max)  Row Source Operation
---------- ---------- ----------  ---------------------------------------------------
         1          1          1  TABLE ACCESS BY INDEX ROWID T4 (cr=3 pr=0 pw=0 time=599 us starts=1 cost=2 size=24 card=1)
         1          1          1   INDEX UNIQUE SCAN T4_PK (cr=2 pr=0 pw=0 time=562 us starts=1 cost=1 size=0 card=1)(object id 87514)
See the highlighted lines 12 and 25. We are back to a conventional access path as soon as we enable SQL trace. The runtime is similar to “t1 – heap-organized” plus some SQL trace overhead. SQL trace is a dead end.
Let’s try flame graphs. Luca Canali wrote an excellent blog post about flame graphs for Oracle. I’ve followed Luca’s instructions to produce some flame graphs. The PNGs are shown below. You may open the SVG variant via the link in a new browser tab.
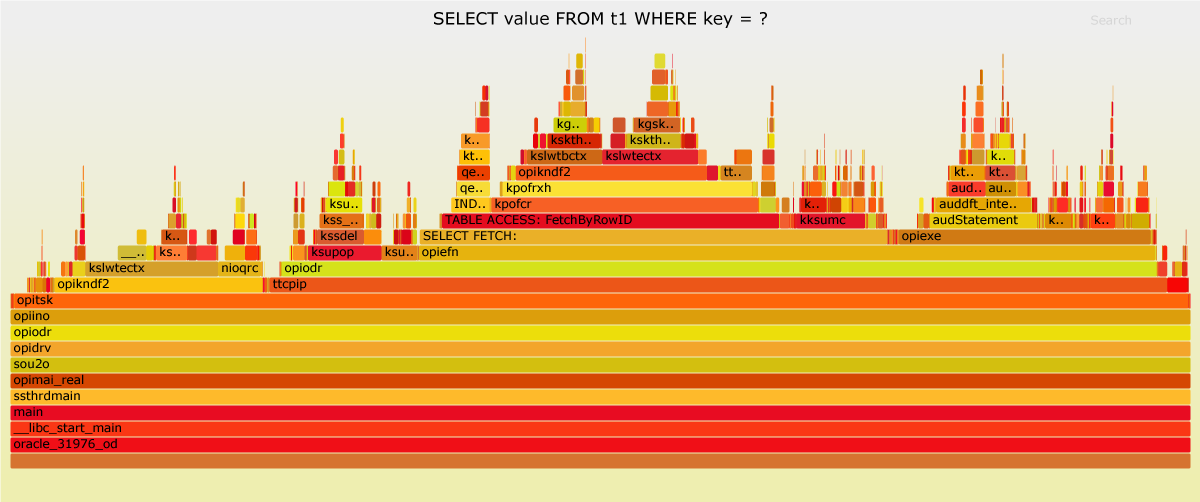
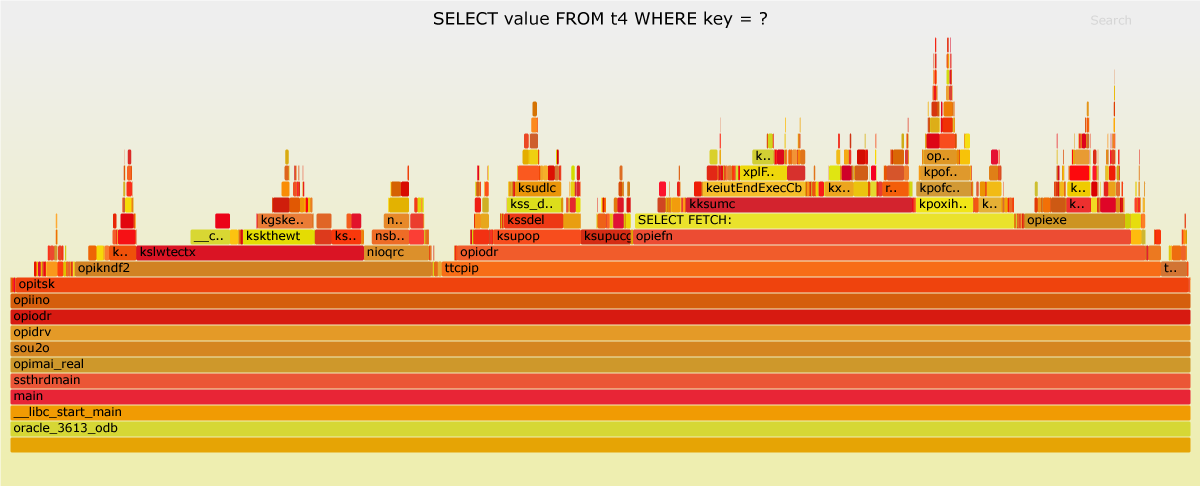
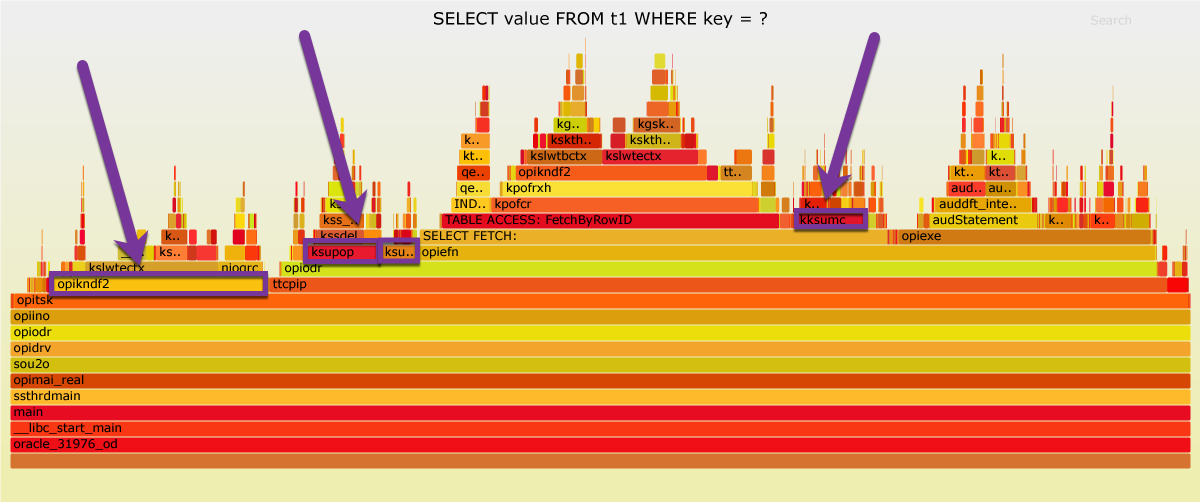
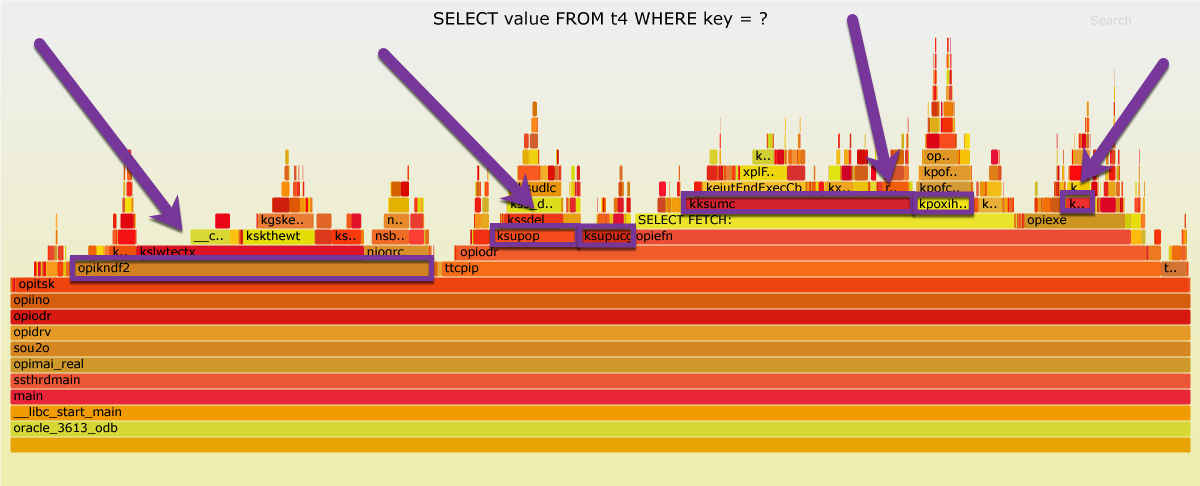
The average runtime of “t4 – memoptimized” was 77.33 seconds and the average runtime of “t1 – heap-organized” was 48.21 seconds. That’s a difference of about 30 seconds. How can we find the functions in “t4 – memoptimized” which are contributing the most to this difference?
First, we assume the amount of sampled data is good enough to represent the load pattern. Second, we assume that we can calculate the runtime of a function based on the percentage shown in the flame graph. This allows the findings to be presented as follows:
| Function | t1 Percent | t4 Percent | t1 Time | t4 Time | Difference |
|---|---|---|---|---|---|
| opitsk | 99.53% | 99.37% | 47.98 | 76.84 | -28.86 |
Third, we are looking for functions on a reasonable level in the call stack. In this case, it is not helpful to state that the opitsk function is slower in “t4 – memoptimized”. Reasonable means, that the identified function are sampled in different call stacks. This is avoiding double counting.
The following table lists 6 functions that account for more than two thirds of the total runtime of “t4 -memoptimized”. In total, they consume 36.66 seconds more than in “t1 – heap-organized”. In the tab pane above, there are flame graph variants named “marked”, highlighting these functions.
| Function | t1 Percent | t4 Percent | t1 Time | t4 Time | Difference | Notes |
|---|---|---|---|---|---|---|
| opikndf2 (from optisk) | 17.64% | 30.22% | 8.50 | 23.37 | -14.86 | |
| kksumc (from SELECT FETCH:) | 6.10% | 19.18% | 2.94 | 14.83 | -11.89 | |
| kpoxihFetch | 0.00% | 4.86% | 0.00 | 3.76 | -3.76 | Fetch from memoptimize buffer area, n/a in t1 |
| ksupop | 6.24% | 7.40% | 3.01 | 5.72 | -2.71 | |
| ksupucg | 3.00% | 4.24% | 1.45 | 3.28 | -1.83 | |
| kpoxihLookup | 0.00% | 2.07% | 0.00 | 1.60 | -1.60 | Hash index lookup, n/a in t1 |
| Total | 32.98% | 67.97% | 15.90 | 52.56 | -36.66 |
Someone with access to the source code of these functions could dig deeper, but I can’t. So I have to stop here. I don’t know how much my unsupported environment contributed to this bad performance. I just can hope it is a lot.
Updated on 2018-06-19: After some research I found the root cause. OCI is a prerequisite for getting good performance out of the MemOptimized RowStore. The succeeding blog post gives you more details about that.
Conclusion
If you access Oracle Databases with #NoPlsql applications, the MemOptimized RowStore might be an interesting feature to improve the performance when querying single rows from single tables via the primary key. If you access Oracle Databases with #SmartDB applications, you cannot use this feature, since it does not work when the SQL query is called from PL/SQL. That’s sad. However, it is disturbing that activating SQL trace or setting STATISTICS_LEVEL = 'ALL' deactivates the MemOptimized RowStore. I hope this will be fixed in a future release.
Updated on 2018-06-19, added OCI as a prerequisite and link to succeeding blog post.
5 Comments
[…] June, 10 2018 I blogged about the MemOptimized RowStore in Oracle 18c. If you haven’t read this post, it is a good idea to catch up now. I showed that accessing a […]
[…] February, 13 2019 Oracle Database 19c is available. I blogged about this feature here and here. Time for an update. So, what’s new in 19c regarding the MemOptimized […]
Thanks a lot! It’s the best article I found up to now about MemOptimized RowStore.
I’m trying to reproduce your tests. But I’m failing with the umcompreensible (at least to me) error:
But USERS tablespace are not with COMPRESS clause, nor I’m using COMPRESS clause on create table.
Have you tried to use the
NOCOMPRESSoption explicitly?What is the result of
select * from dba_ilmpolicies;?What is the result of
select banner_full from v$version;?What is the result of
select value from v$parameter where name = '_exadata_feature_on';?If you running this on a EE-ES, DBCS EE-EP or ExaCS system, then I suggest to contact Oracle support.