

Today I released an update of the utPLSQL extension for SQL Developer. In this blog post, I explain the changes in the latest version 1.2. These are the new features:
Download the latest version from GitHub.
Debug Test
Now you can run one or more utPLSQL tests with the PL/SQL Debugger. To do this, select the context menu item Debug utPLSQL test... from the Connections window.
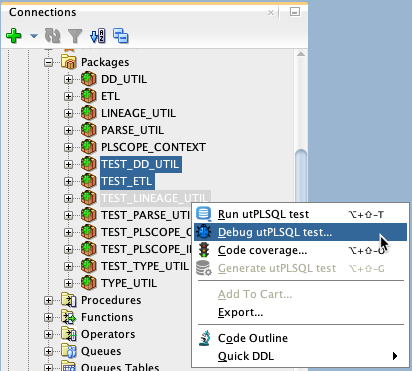
This context menu item is also available in
- the PL/SQL Editor
- the Worksheet
- the Realtime Reporter
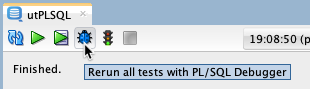
Additionally, you can rerun all tests with the PL/SQL Debugger from the toolbar in the Realtime Reporter.
Debugging works with
DBMS_DEBUG_JDWP(the default in SQL Developer, opens a TCP/IP connection from the database to the client, suited for remote debugging of PL/SQL code, e.g. from an APEX application) andDBMS_DEBUG(deprecated package without remote debugging capabilities, using SQL*Net based sessions only).
You can select the debugging package in the preferences of SQL Developer 20.2. For older versions see this blog post to learn how to switch the debugging package.
See this slide deck or this video for more information about the PL/SQL Debugger and how to make it work in your environment.
Cancel Test Run
By default, a test run is terminated when the initialization takes longer than 60 seconds or the whole test run exceeds the limit of four hours.
When debugging a test run, you might want to debug the utPLSQL framework execution itself. Therefore we changed the initialization timeout to one hour when debugging a utPLSQL test. When the debug session crashes or you decide to stop it, the Realtime Reporter continues to wait for test events. But since the producer session is stopped, no test events are created for the Realtime Reporter any more. In this case, you can just cancel the test run by clicking on the red button in the toolbar of the Realtime Reporter. As you see in the next screenshot.
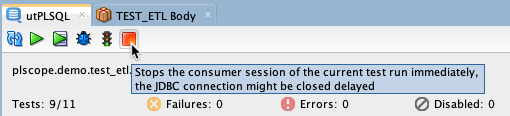
Of course, you can use this feature also to cancel any other test run. For example, if you started a long-running test by accident.
What happens behind the scene when you’re cancelling a test run?
First, the JDBC session associated with the Realtime Reporter (the consumer) is aborted. This will lead to the termination of the test run and if the producer session is still running, then it is aborted as well. An abort of a JDBC connection will delegate the termination of the associated database session to the Oracle Database. However, it might be necessary to kill those sessions using ALTER SYSTEM KILL SESSION or ALTER SYSTEM DISCONNECT SESSION.
Second, all remaining tests of the terminated test run are marked as “disabled”. A warning message “Test disabled due to abortion of the test run.” is added to each disabled test.
Test Run with Code Coverage
utPLSQL uses reporters to show the results of a test run. I categorize the active reporters as follows:
- Test run events reported as stream (for continuous consumption by other applications such as SQL Developer)
- Realtime Reporter (
ut_realtime_reporter, XML document per event)
- Realtime Reporter (
- Test run result reported as stream (for full or partial, continuous consumption)
- Documentation Reporter (
ut_documenation_reporter, plain text optionally with ANSI escape sequences)
- Documentation Reporter (
- Test run result reported as document (for full consumption)
- Instrumentation
- Debug Reporter (
ut_debug_reporter, XML).
- Debug Reporter (
- Test results
- JUnit Reporter (
ut_junit_reporter, XML) - Teamcity Reporter (
ut_teamcity_reporter_helper, XML) - TFS/VSTS Reporter (
ut_tfs_junit_reporter, XML) - SonarQube Reporter (
ut_sonar_test_reporter, XML)
- JUnit Reporter (
- Code coverage
- HTML Coverage Reporter (
ut_coverage_html_reporter, HTML) - Coveralls Reporter (
ut_coveralls_reporter, JSON) - Cobertura Reporter (
ut_coverage_cobertura_reporter, XML) - SonarQube Reporter (
ut_coverage_sonar_reporter, XML)
- HTML Coverage Reporter (
- Instrumentation
utPLSQL supports an unbound number of reports per test run. As a result you can produce with a single test run as many results as you like. The utPLSQL-cli supports that very well.
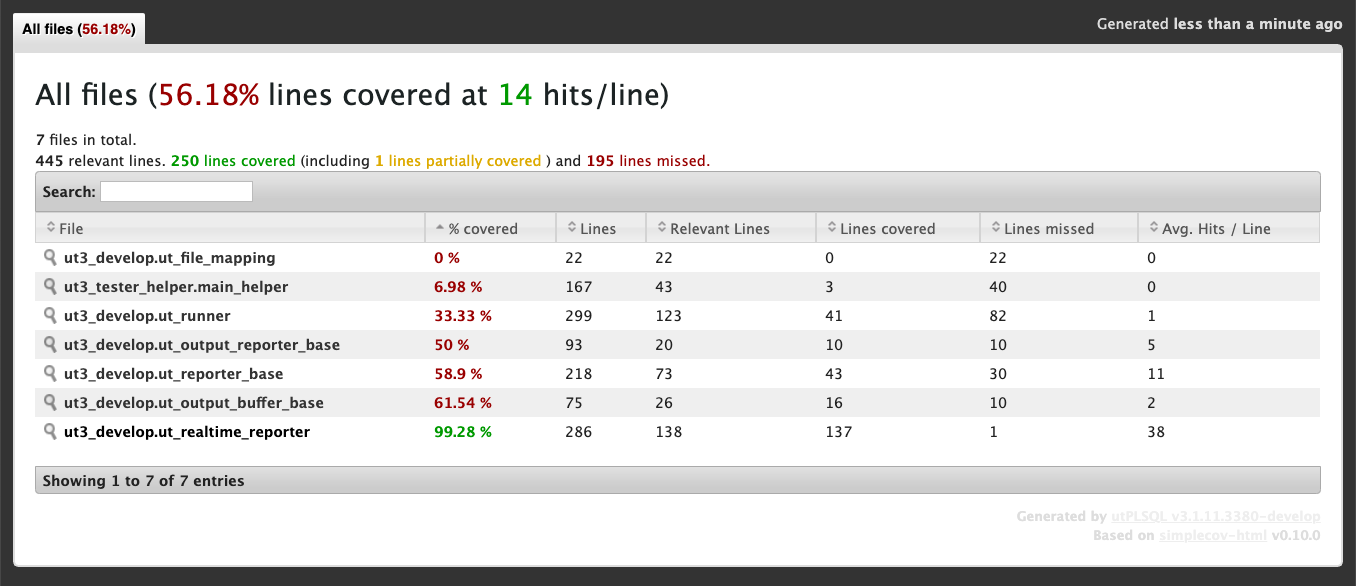
The SQL Developer extension now also uses this feature. The Realtime Reporter and the HTML Coverage Reporter run together. The GUI shows the progress of the test run. And at the end of the test run the HTML Coverage opens in your default browser. Nice. However, most of the work for the HTML Coverage Report is done at the very end of the tests run. Therefore you might experience a delay before the HTML Coverage Report becomes visible.
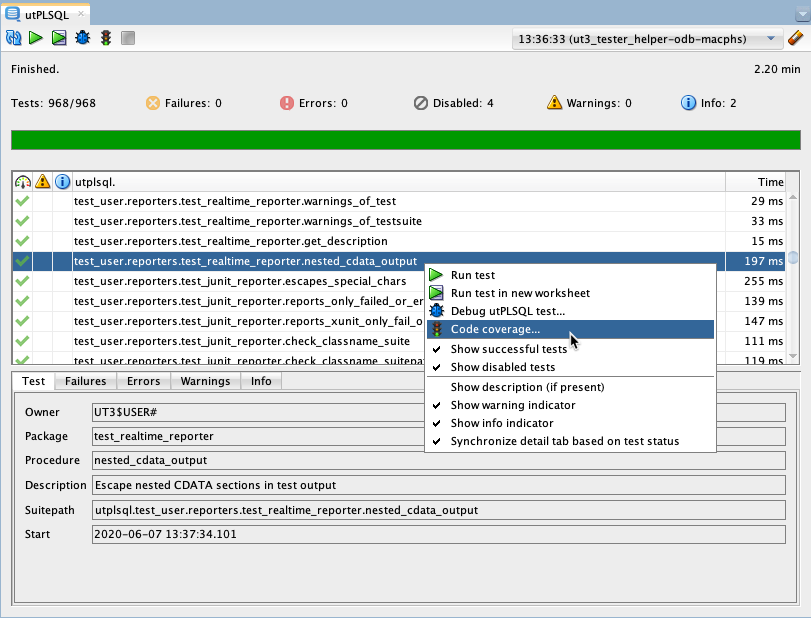
You can also run Code Coverage from the Realtime Reporter for the complete test run via the toolbar or for selected tests via the context menu.
In this case it is possible to calculate a reasonable default value for Schemas under test. As you see here:
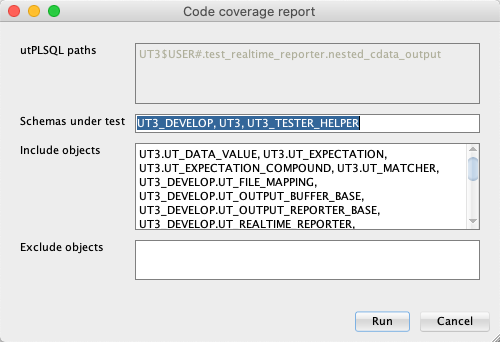
As in previous versions, we calculate the Include objects based on the test package dependencies. In this case we know the owner of the Include objects and these owners are the Schemas under test. Sorted descending by the number of objects in the Include objects. I like this feature since in the utPLSQL core project we store the test packages in dedicated schemas. And a good default means less typing. Time to press Run.
The default produced a bit more than I really wanted. But the ut3_devlop.ut_realtime_reporter is part of the result and the report was fast. So who cares?
Java instead of Xtend
We migrated the complete code base from Xtend to Java. As a side-effect, the extension is now smaller, because we do not need the Xtend runtime libraries anymore. Besides that, you should not notice any difference when using this extension. Please read this blog post, if you’re interested to know why we migrated to Java and how we did it.