

Introduction
In November 2017 Jacek Gebal asked me if I could help to integrate utPLSQL into SQL Developer. In January 2018 we released the first MVP. Tests were executed in a new SQL Developer worksheet showing the result in the script output pane. This was easy to implement and it simplified the use of utPLSQL. But there are some downsides to that:
- Test results become visible after the completion of all tests. This is inconvenient for larger test suites, even if the tests run in an unshared worksheet.
- When a test fails, the developer has to navigate manually to the failing source code line (no hyperlinks).
- Results are monochrome, there is no green or red text, to highlight the test result like in the utPLSQL-cli.
- Overall it looks and feels awkward and it is not so much fun to work with.
While we introduced a couple of new features such as test templates, test generation or code coverage; we never addressed these primary flaws. Surely you have heard the motto “keep the bar green to keep the code clean”. It refers to the JUnit test runner IDE component that displays a progress bar which remains green as long as all tests are passed.
I’m proud to announce that utPLSQL for SQL Developer introduced in version 1.0.0 such a component. Download the latest version from Github. At the end of this blog post, you find an audio-less video, showing the realtime reporter (utPLSQL test runner) in Action.
Content
In this blog post, I show how the utPLSQL test runner works and explain some design decisions.
We had quite extensive threads in our private utPLSQL Slack design channel about various topics. And it became evident that as soon as we talked about the UI, the number of opinions was quite consistent with the number of people involved. So this blog post should help me (and hopefully others as well) to simplify some future discussions around this topic.
Running utPLSQL Tests
There are currently three options to run utPLSQL tests without installing additional extensions (besides utPSQL for SQL Developer).
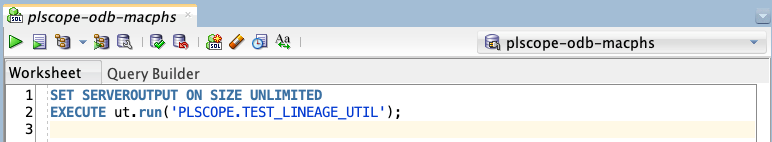
1. Manual
Open a worksheet and type all the necessary commands yourself
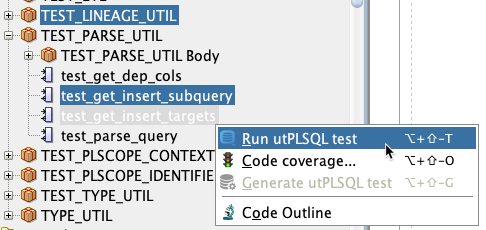
2. From Connections Window
Select one or more nodes (user, schemas, package specifications, package bodies or package procedures), right-click and select Run utPLSQL test from the context menu.
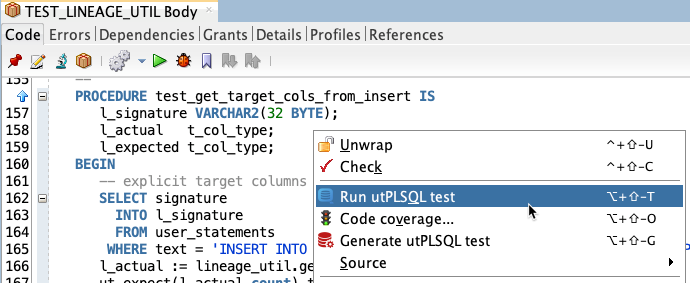
3. From Editor (PL/SQL or Worksheet)
Right-click and select Run utPLSQL test from the context menu in the editor containing a test package or test package body (or both). The cursor position determines the test or suite to be executed. In the following example it’s the package procedure test_linage_util.test_target_cols_from_insert.
Realtime Reporter (utPLSQL Test Runner)
utPLSQL supports an unbounded number of reporters, that can be attached to a test run. For example:
ut_documentation_reporterfor human-readable output on a consoleut_junit_reporterfor CI environments like Jenkins or Bamboout_coverage_html_reporterfor code coverage report in HTML formatut_realtime_reporterfor IDEs such as SQL Developer or TOAD
We call the utPLSQL test runner window in SQL Developer also “realtime reporter”, since it shows the results of a test run in near-realtime.
The realtime reporter uses for every run two fresh connections to the database. One to run the tests (producer) and the other to read the results continuously (consumer). For a good user experience, it is important that you save the password of the connections used for utPLSQL within SQL Developer. Otherwise, you will be prompted for the password. In fact twice. For the producer and the consumer session.
Default Layout
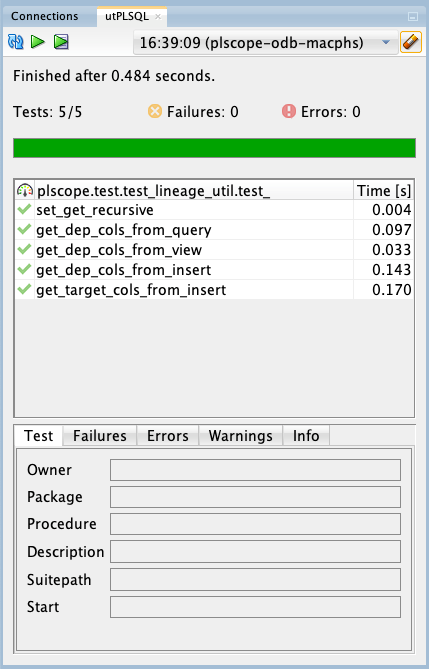
By default, you find the dockable window next to the Connections window. At this position, we want a narrow window, so that there is enough space on the right side for editors. You can move this window to any position you like and change its size. SQL Developer saves the settings on exit. The following screenshot shows the realtime reporter with default settings.
Components
We use Java Swing components. It’s possible to use others, but SQL Developer uses mostly Swing components as well. Hence, we decided to go this way as long as there is no pressing reason to change that.
The visualization of Swing components depends heavily on the chosen Look & Feel (e.g. on Windows the progress bar is segmented). The default Look & Feel for SQL Developer is on all platforms “Oracle”. On Windows you may change it to “Windows”, on macOS to “Mac OS X” and on Ubuntu to “Metal”. In this blog post, I use the Oracle Look & Feel. It works best on all platforms.
Window Title
The representation of the window title depends on the window position. Within a tabbed pane on the leftmost docking area, it looks like this (in this area we would like to present titles as compactly as possible, hence small font and no icon) :

In all other docking areas, an icon appears left to the text and the text font is bigger. It looks like this:

Within the SQL Developer framework (which is based on JDeveloper) certain standards in place are responsible for the final representation.
Toolbar

The components on the toolbar from left to right have the following meaning:
 Reset ordering and refresh: Restores default sort order and deselects all tests.
 Rerun all tests: Reruns all tests shown in the current realtime reporter, the selected tests are not changing the behaviour, because it would be cumbersome to rerun all tests.
 Rerun all tests in new worksheet: The same logic as the previous button, but runs the tests in a new worksheet.
 Run history: The identifier of a run is the start time and the connection name in parenthesis. The last ten runs are kept by default. Select another run anytime. The UI should never be blocked.
 Clear run history: Clears all history entries, except the currently selected run.
Important: the scope of the rerun buttons in the toolbar is the complete run. Always.
Run Status
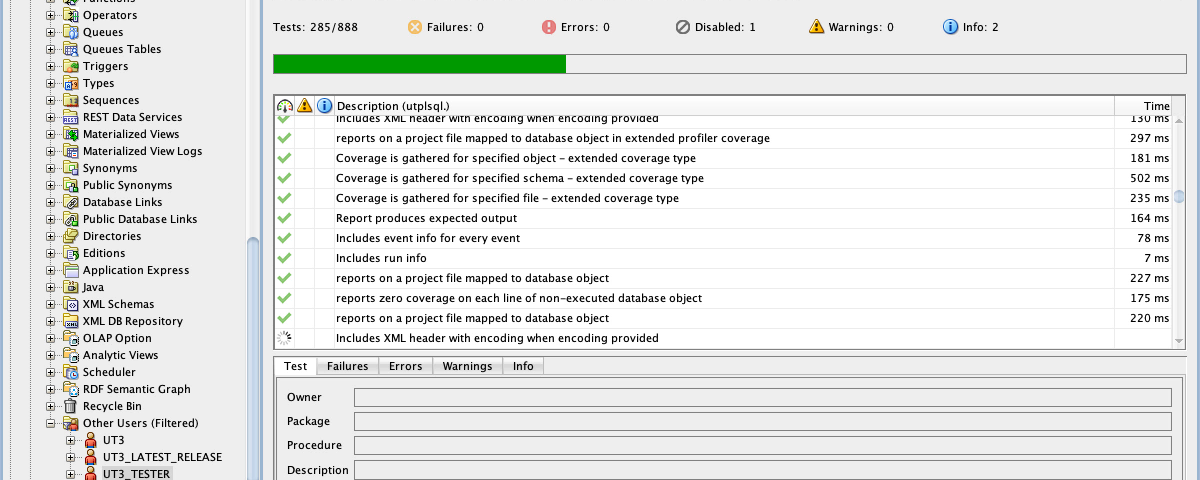
The next screenshot shows the final status of a test run.
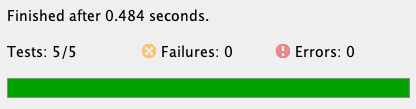
At the top, we see a textual status and at the bottom, the progress bar indicates success via a green and failure or error via a red bar. The textual status either ends on ... or . as an additional indicator for the completeness of a test run.
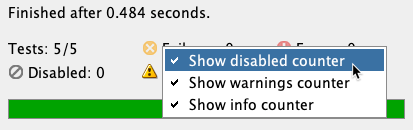
In the middle are some counters. All counters have an associated icon, except the first one, Tests, to reserve space for larger numbers (e.g. 4242/4242). All counters have the same width to represent them as columns, e.g when including additional counters like here:
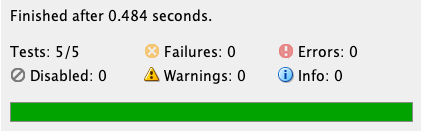
You can enable/disable these additional counters via context menu or in the utPLSQL preferences.
Test States
A test has one of the following final states:
 success: the expected value matches the actual value
 failure: the expected value does not match the actual value
 error: there was an error during the test execution
 disabled: the test is not enabled and therefore not executed
The sum of these counters matches the total number of tests.
Warnings and Informational Messages
Additionally, every test may have:
 warnings:
- These are messages by the utPLSQL framework.
- You should get rid of these warnings, even if they do not affect the correct outcome of your tests.
- You may do that by amending your test code or your program under test.
 info:
info:
- These are
DBMS_OUTPUTmessages by the program under test or by the test code. - The utPLSQL framework does not produce such messages.
- They do not affect the correct outcome of a test.
- Why is this called
infoand notDBMS_OUTPUTorserver outputor simplyoutput? Well, there are some practical reasons.infois short and has a nice, known icon. Besides that, we name here the content/severity (informational message, that does not affect the outcome of a test) and not the transportation mechanism (DBMS_OUTPUT). As a result, this is concise withfailure,errorandwarning.
- These are
Test Overview
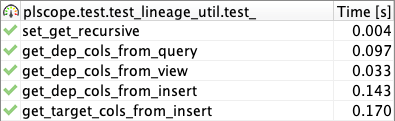
By default, this tabular representation of all tests has the following three columns:
 Test status:
- Contains one of the following four test states:
- success
- failure
- error
- disabled
- You may sort by this column, even if it contains icons only.
- Contains one of the following four test states:
- Suitepath/Description
- By default, this column shows the suitepath of a test.
- A suitepath can be very lengthy.
- To get a narrow representation, the header of the column is set to the common prefix of all tests. In this case it’s
plscope.test.test_lineage_util.test_. - Via context menu, you can enable the description of a test instead of the suitepath. However, if a description is missing, the suitepath is shown nonetheless.
- Time [s]
- Execution time in seconds of the test
- Please note that the sum of all tests does not match the run time in the run status, because initialization times and times spent on suite level are not reported here.
You may sort the overview table by clicking on a column. The first click sorts them ascending, the second click descending. To restore the original order, press ![]() in the toolbar. Ascending sort order for test status means:
in the toolbar. Ascending sort order for test status means: ![]() ,
, ![]() ,
, ![]() ,
, ![]() .
.
Warnings and Informational Messages
You can enable/disable these additional indicators via the context menu or in the utPLSQL preferences.
Rerun Selected Tests
You can select one or more tests and rerun them. Either in realtime reporter or in a new worksheet.
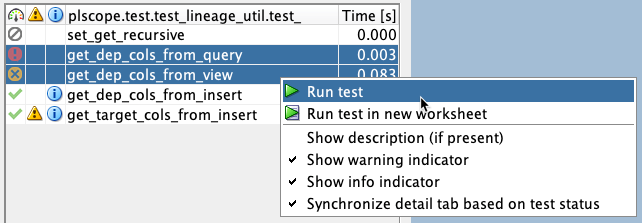
Table or Tree?
utPLSQL test suites are hierarchies. A tree view would be a natural choice, right? Well, yes for the hierarchical representation, this is correct. We already use that in the oddgen integration. Sorting is a simple way to group tests, and find failed or slow tests. However, sorting is not easy in a tree. Even a combined tree/table structure does not help sort the complete result set. And there are other issues. Filtering tests and presenting a well-arranged result, for instance. Because of these limitations, we decided to go with a simple table.
That said, I think, that we should provide rather sooner than later an alternative hierarchical view to give the test descriptions (representing features/requirements) a better context. The suite descriptions are currently lost and this is really sad for projects that have good suite and test descriptions.
Test Results on Suite Level
But what happens with results on the suite level? – We ignore them. With two exceptions. Warnings and informational messages on the suite level are included in the last test of the suite. Here’s an example of warnings:
Open PL/SQL Editor
Double-click on a test in the test overview table to open the PL/SQL package specification at the line of the associated test procedure.
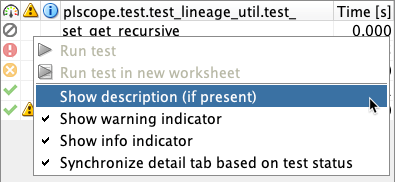
Synchronize Detail Tab Based on Test Status
By default, the most relevant detail tab of a test is opened automatically. As a result, you do not need to browse through all detail tabs. Behind the scenes, we use this rule set:
- open
Failuresif number of failures > 0 - open
Errorsif errors is not empty - open
Warningsif warnings is not empty - open
Infoif info is not empty - open
Testin all other cases
You can enable/disable this synchronization via the context menu or in the utPLSQL preferences.
Test Details
There are 5 tabs with detailed information for a test in the test overview.
1. Test
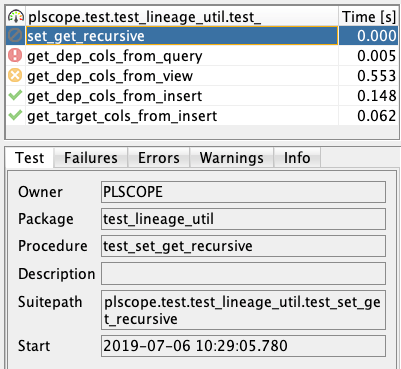
In the best case, successful and disabled tests provide further details in this tab only.
The description is empty in this example. However, the utPLSQL team recommends to use of descriptions. I remember when Jacek Gebal gave me once the following feedback regarding my tests for the ut_realtime_reporter:
Rather than describing what the test is checking:--%test(Check XML report structure), describe the tested code functionality:--%test(Builds appropriate XML report structure). That way, when executing the tests, we see a list of descriptions for functionalities (requirements) that are working.
Good advice. Sounds easier than it is, especially when you want to keep the descriptions short and concise. However, I’m working on it.
2. Failures
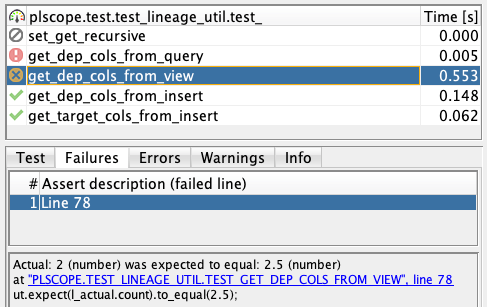
A test may have an unbounded number of asserts. Each failed assert is listed in the failures table. And for each failed assert, you find a detailed failure message. You can either double-click on the row in the failed assert table or click on the hyperlink to open the PL/SQL editor at the line of the failed assert.
I really like that utPLSQL provides a complete list of all failed assertions and does not stop after the first one like JUnit.
3. Errors
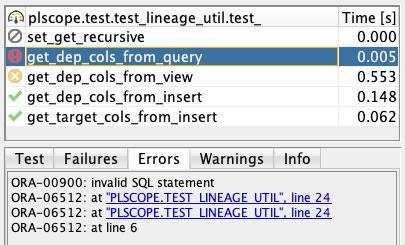
Errors that occur during the execution of a test are reported here. However, if an error occurs on the test suite level, for example in a procedure annotated with %afterall, then these errors are considered warnings by the utPLSQL framework and are reported in the warnings tab.
Click on a hyperlink to open the associated source code line in the PL/SQL editor.
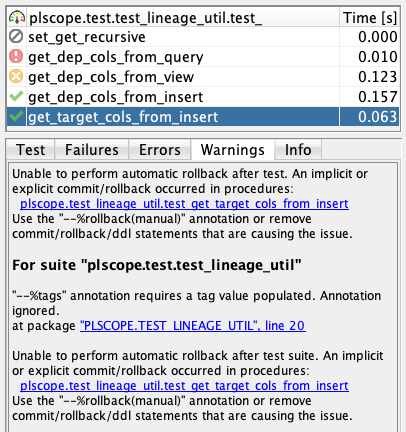
4. Warnings
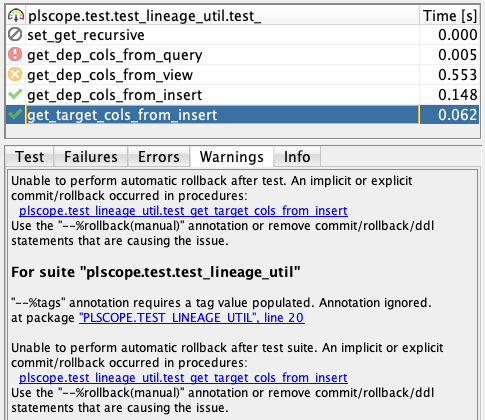
When you read the warnings casually then you might get the impression that the rollback warning is reported twice. However, the first warning was for the rollback after test. The second warning was for the rollback after test suite. The last test of a suite also contains the warnings at the suite level. For example, the warning about the incomplete –%tags would have been lost, if only warnings at the test level had been reported.
Click on a hyperlink to open the associated source code line in the PL/SQL editor.
I recommend using utPLSQL v3.1.8 or later (which will be released soon). Starting with this version, utPLSQL answers the following question regarding the link to the source code: Do I have to open the package specification or the package body? In this case (at package "PLSCOPE.TEST_LINAGE_UTIL", 20) it’s clear. But without the package token, utPLSQL for SQL Developer assumes that the package body is meant.
Important: Warning messages have been introduced in the ut_realtime_reporter of utPLSQL v3.1.7. Therefore warning messages are empty if you use v3.1.4, v3.1.5 or v3.1.6.
BTW, I see no reason to work with an old version of utPLSQL, besides the fear of new bugs. utPLSQL is basically stateless, which means there is no data to be migrated. Hence, a complete reinstall is always feasible and the annotation cache will be recalculated automatically. If you really stumble over a critical bug, then fix it by installing the previous version. It is simple enough. And don’t forget to let us know. Thanks in advance. ;-)
5. Info
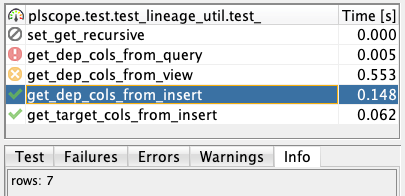
The utPLSQL framework captures all DBMS_OUTPUT messages.
If these messages contain source code references, then these references are converted to hyperlinks as shown in the tabs Failures, Errors and Warnings.
Realtime Reporter in Action
In this 2.5 minute audio-less video (in original speed) I run a test suite using utPLSQL for SQL Developer v1.0.0. And I fix 1 error, 1 failure, 1 warning, 2 informational messages and re-enable a disabled test.
2 Comments
Please inform whether utPLSQL api plugin has any known bugs within Oracle SQL Developer 23.1.0.097.1707
Do you have issues with this SQLDev version? Then please visit the GitHub repository for further information and open an issue there, if necessary. Having said that, I use SQLDev 23.1 and utPLSQL without any problems. Thanks.